
Inside the LiveWire Data Dashboard

For years, our users have been asking for a way to interact with data from our social tools. And so we’re very excited to announce the launch of the Clear Admit LiveWire Data Dashboard!
The LiveWire Data Dashboard comprises three interactive tools that allow you to engage with LiveWire GMAT/GRE and GPA data in aggregate. You can also benchmark your academic credentials against those of successful applicants at your target schools.
Read on for an inside look at each of the three Dashboard tools (or jump to one using the links below):
- Outcome Forecast: Curious about your chances? Benchmark your stats against the full range of admissions outcomes at a single school.
- School Comparison: Wondering how programs compare? Select a LiveWire status and plot academic stats for up to four schools at a time.
- Benchmark Overview: Still deciding where to apply? Instantly compare your undergraduate GPA and test score to those of LiveWire users applying to 20 leading MBA programs.
The Livewire Data Dashboard is a premium site feature. Visit the Clear Admit shop to purchase a 30- or 365-day subscription!
![]()
For the best user experience, we recommend that you use the LiveWire Data Dashboard on a computer rather than a mobile device.
This interactive tool is provided for informational purposes only.
Because Clear Admit site users represent only a portion of applicants to leading MBA programs, academic statistics and outcomes submitted via the Wire tools may not be representative of the candidate pool as a whole. Moreover, in a constantly evolving admissions landscape, past years’ results may not be predictive of outcomes for the current admissions season.
To support the representativeness and accuracy of resources based on analyses of MBA LiveWire data, we encourage you to share your own results with the Clear Admit community this admissions season.
Outcome Forecast Tool
First, select an MBA program. The Outcome Forecast plots the GMAT/GRE and corresponding GPA of LiveWire post reflecting Accepted, Interview Invite, and Rejected decisions. This tool provides a high-level view of LiveWire users’ outcomes, enabling you to spot trends and learn about each school’s admissions standards.
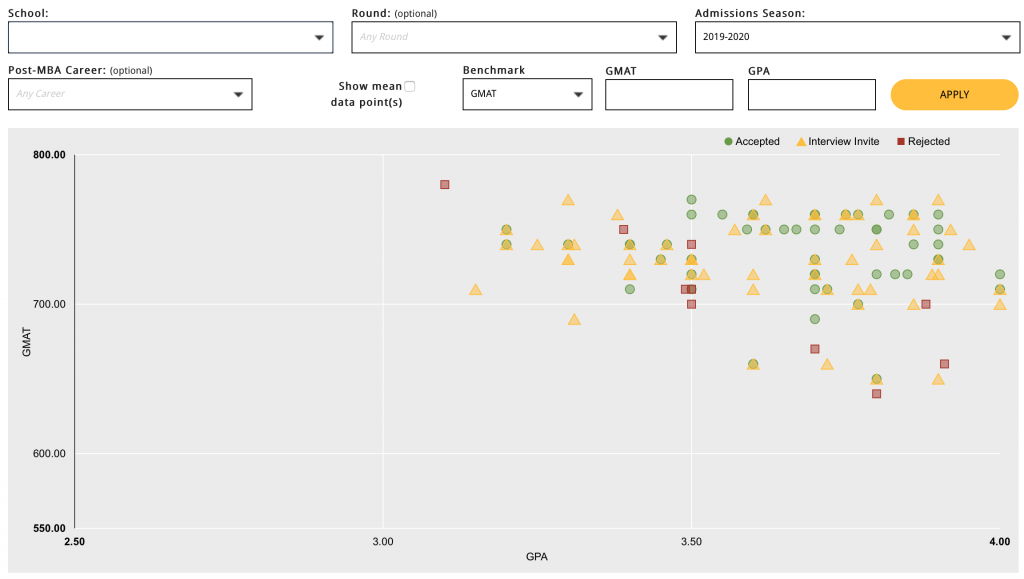
To customize your research, you can filter your selections based on Round, Admissions Season, Post-MBA Career Goal, and GMAT vs. GRE. Data for the current year (2020-2021) are updated daily to capture the latest LiveWire posts.

Of course, admissions is about much more than grades and test scores.
Hover over any data point to see more information about that LiveWire user. To simplify your view, single-click any item on the legend to hide those data points, or double-click to display only those points.
You can also add your own information to benchmark your academic profile against other applicants in the LiveWire database.
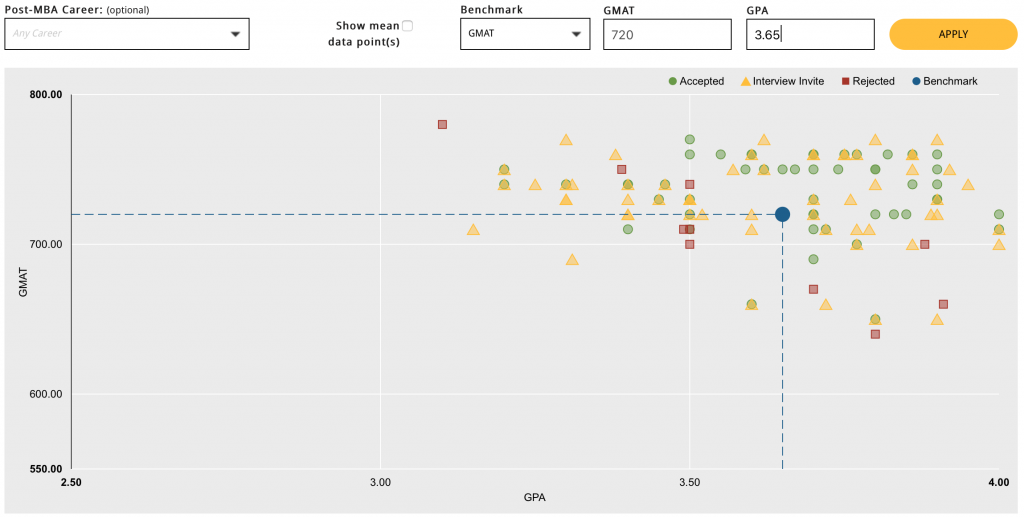
Finally, select “Show mean data point(s)” to see where the average GMAT/GRE and average GPA intersect for each admissions outcome.
In summary, the Outcome Forecast is designed to help you hone in on a single school and understand the characteristics of applicants who reported both positive and negative results – on both individual and aggregate levels.
![]()
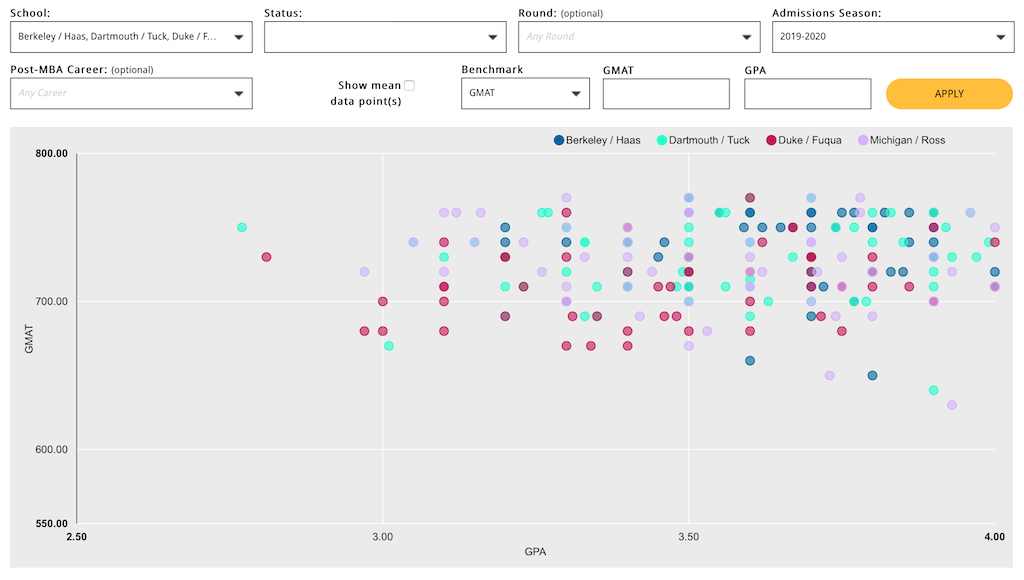
School Comparison Tool
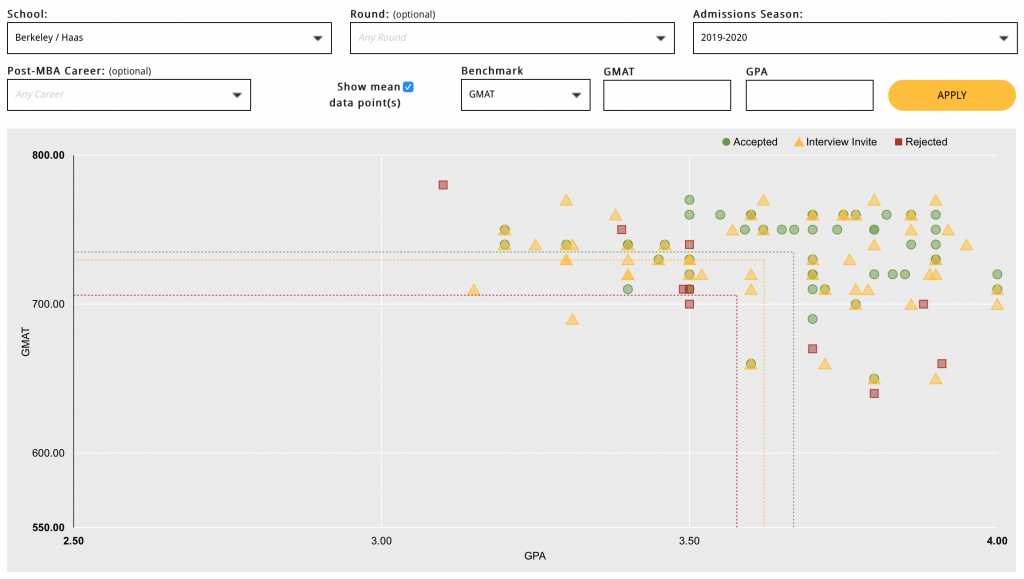
Select a LiveWire status and up to four MBA programs. The School Comparison plots the GMAT/GRE and corresponding GPA of LiveWire posts from each school reflecting the selected admissions outcome.
This tool offers a high-level view of how the academic profiles of successful (and unsuccessful) applicants compare across different MBA programs.
To customize your research, you can filter your selections based on Round, Admissions Season, Post-MBA Career Goal, and GMAT vs. GRE. Data for the current year (2020-2021) are updated daily to capture the latest LiveWire posts.
Of course, as we mentioned above, admissions is about much more than grades and test scores.
Hover over any data point to see more information about that LiveWire user. To simplify your view, single-click any item on the legend to hide those data points, or double-click to display only those points.
You can also add your own information to benchmark your academic profile against other applicants in the LiveWire database.
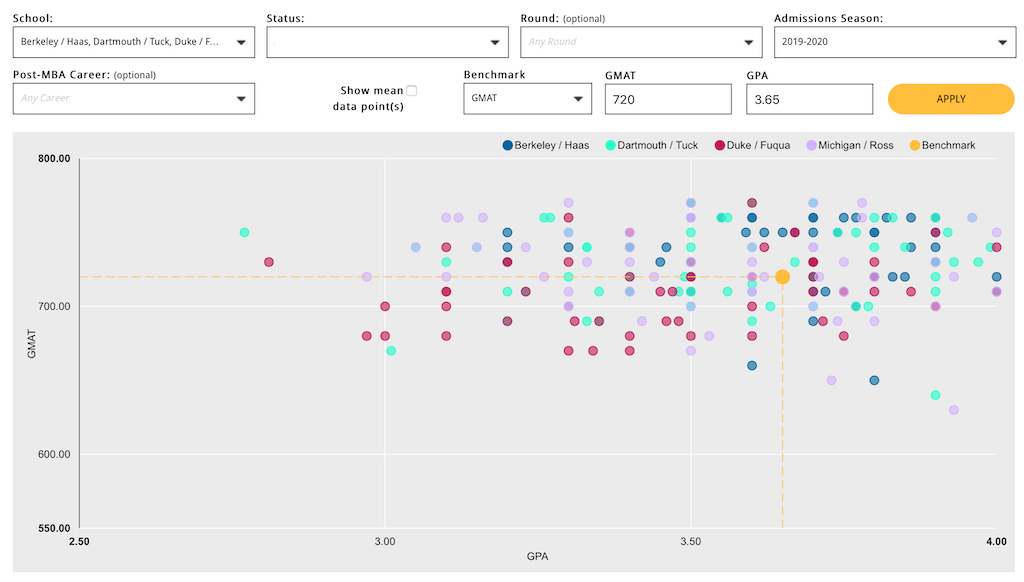
Finally, select “Show mean data point(s)” to see where the average GMAT/GRE and average GPA intersect for each admissions outcome.
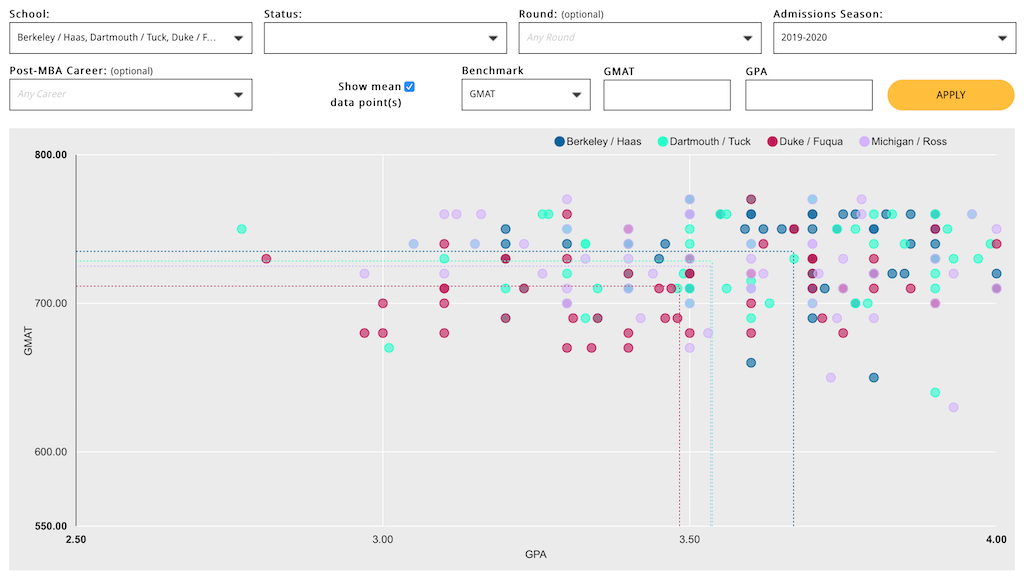
In summary, the School Comparison tool allows you to select an admissions outcome (e.g. Accepted, Interview Invite, Waitlist, Rejected) and compare schools at a high level – while learning about the individual LiveWire users who reported each update.
![]()
Benchmark Overview Tool
The Benchmark Overview allows you benchmark yourself against applicants to twenty MBA programs at once.
Simply select a LiveWire status and enter a test score and/or GPA. You’ll see the percentage of LiveWire entries posted by applicants whose numbers were equal to or lower than yours. Akin to a percentile score, this calculation tells you where you fall in the larger distribution of LiveWire users reporting positive outcomes at each school.
To be included on this tool, an MBA program must have at least 450 LiveWire posts.
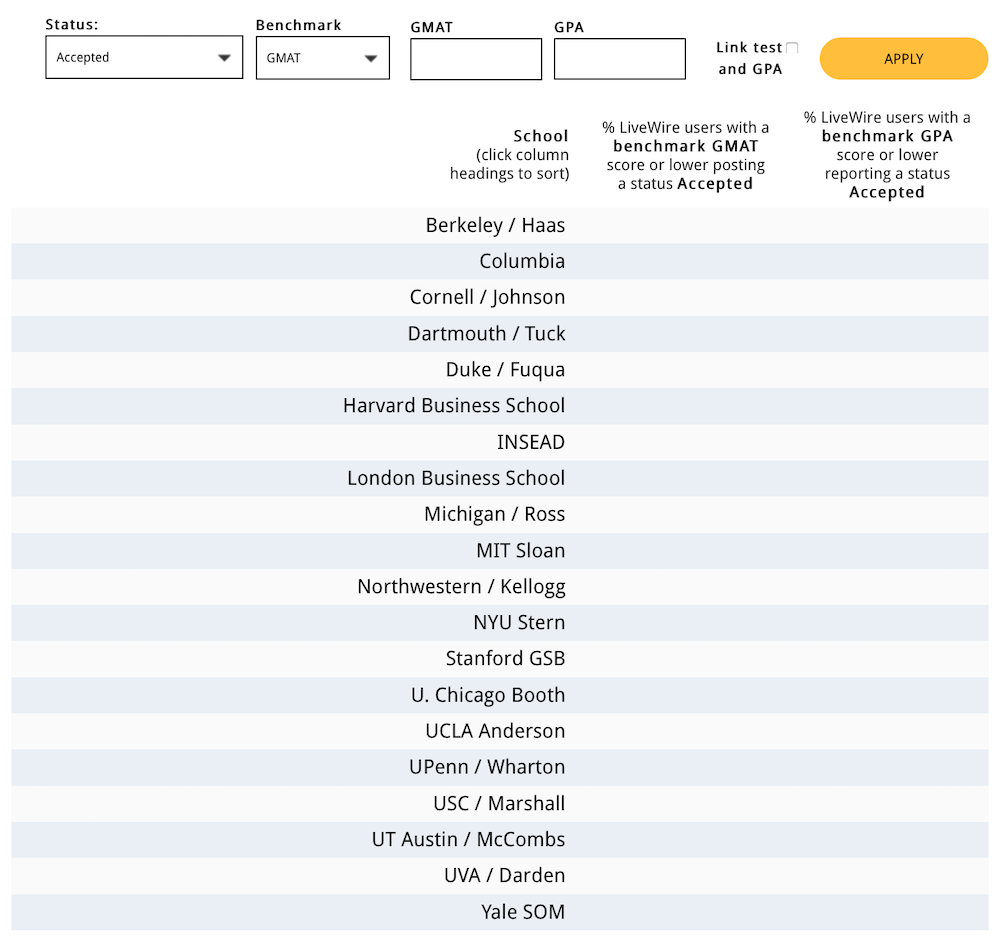
Once you’ve generated results, hover over any percentage to see the number of entries it’s based on. Click once on the heading to sort schools in descending order. Click again to sort in ascending order.
By default, this tool presents all available LiveWire data. Check the “Link test and GPA” box to see data only from those users who took your selected benchmark test.
In summary, the Benchmark Overview allows you efficiently compare your scores to those of successful applicants at a range of MBA programs, helping you understand how you compare to successful LiveWire users.
![]()