

Clear Admit’s MBA LiveWire has been ON FIRE these past two weeks with Round 1 applicants sharing their triumph and defeat in the MBA admissions process at top schools. With 18 schools releasing decisions this week—Wharton, Darden, MIT Sloan, Ross and Tuck among them—we expect record activity to continue, and we’ll be keeping tabs on the decisions as they roll in. In the meantime, we’re digging into some of the data shared last week, specifically with regard to how applicants fared at Harvard Business School (HBS) and the University of Chicago Booth School of Business.
First up, let’s take a look at HBS, which released Round 1 decisions on December 9th, just as promised.
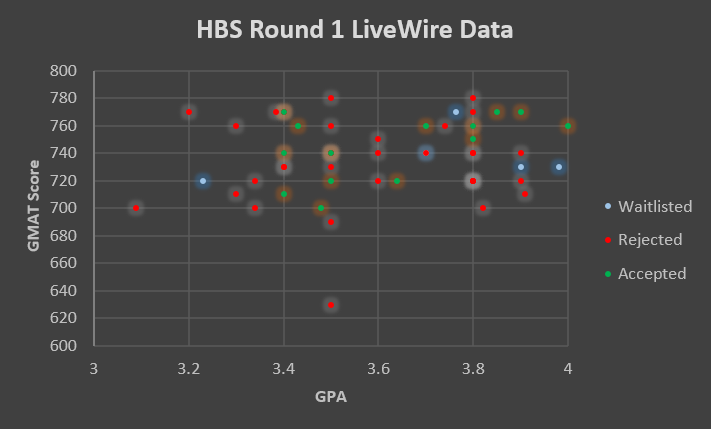
Reported GPAs for those who were admitted to the Class of 2017 at HBS ranged from 3.4 to 4.0, with an average of 3.72. The GMAT score range was from 700 to 770, with an average score of 738. For those waitlisted, the ranges and averages were much the same. (The GPA range was 3.23 to 3.98 with an average of 3.67, and the GMAT score range was 720 to 770, with an average of 740). Those who didn’t make the cut, meanwhile, had GPAs between 3.09 and 4.4 (average, 3.65) and GMAT scores between 630 and 780 (average, 743). Those rejected from HBS were at least in good company—representing 66 percent of LiveWire reports. Acceptances accounted for 24 percent, and waitlisted applicants comprised the remaining 10 percent.
As was the case when interview invitations were extended for HBS, the main conclusion to be drawn is that you can’t expect to get into HBS without really great stats, but great stats alone don’t guarantee admission.
Of course, we should note that our sample size is relatively small and likely subject to some response bias, which is to say that applicants who were accepted to HBS may be more likely to share the news publicly (albeit anonymously).
Greater Percentage of Acceptances at Chicago Booth
A look at data for Chicago Booth, where decisions were also released on December 9th, reveals similar patterns. Here, reported GPAs for applicants who were accepted ranged from 2.63 to 4.2, with an average of 3.62. GMAT scores, meanwhile, fell between 620 and 760, with an average score of 732. For those who were placed on the waitlist, GPAs ranged from 3.09 to 3.95, averaging 3.63, and GMAT scores ranged from 700 to 770, with an average of 727. Those who got a ding, meanwhile, had GPAs between 2.95 and 4.0 and GMAT scores between 710 and 770, with averages EXACTLY the same as those accepted (GPA, 3.62; GMAT score, 732).
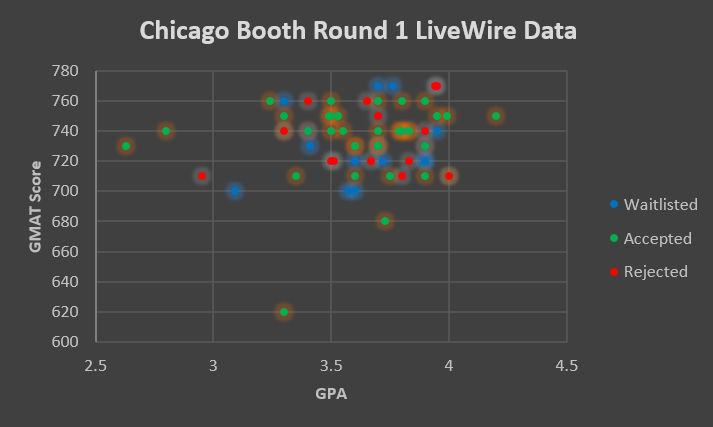
With Chicago Booth data, as with the data regarding HBS applicants, the sample size was small and selection bias may also be at play. Not entirely surprisingly, LiveWire reports were far more positive for Chicago Booth applicants than for those who applied to HBS. Those reporting acceptances at Chicago Booth represented 54 percent of total LiveWire submissions, compared to 23 percent waitlisted and 20 percent rejected.
Thanks for sharing your results via Clear Admit’s LiveWire. With hundreds more submissions coming in from applicants to schools releasing decisions this week, we’re already at work parsing that data, so stay tuned.


