



Base pay for graduates of the M7 business schools has climbed 40% over the past decade.
Contrary to some recent assertions that the MBA is declining in value, particularly in post-MBA starting salaries, we take a deeper dive into the historic data. Clear Admit’s Graham Richmond espoused the enduring value of the MBA–but what about the numbers?
Below, we review the post-MBA median base salaries for recent graduates from top MBA programs and the salary figures have been increasing.
The table below shows median base salary for MBA graduates of the M7 business schools — Chicago Booth, Columbia Business School (CBS), Harvard Business School (HBS), Kellogg, MIT Sloan, Stanford GSB and Wharton — for the Class of 2016 vs. the Class of 2025, drawn from each school’s published employment reports.1
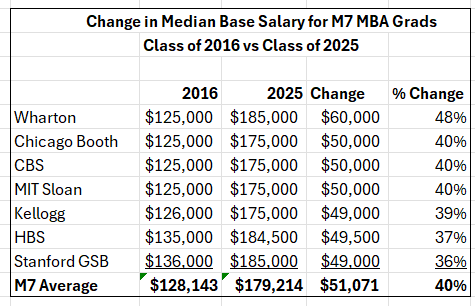
Over the past ten years, the average of the M7 median base salaries grew by 40% from $128,143 for the MBA Class of 2016 to $179,214 for the MBA Class of 2025. All M7 programs reported growth ranging from 36% for Stanford GSB graduates to 48% for Wharton graduates. Six of the seven reported growth of about $50,000 in median base salary while Wharton reported a $60,000 increase.
The value of the MBA degree endures even when we factor in inflation. Since all seven of the M7 schools are US-based, and since about 90% of the graduates of these schools who are seeking employment and accept jobs happen to accept jobs with US-based firms, we used US Consumer Price Index data as reported by the US Bureau of Labor Statistics to calculate the real purchasing power.2
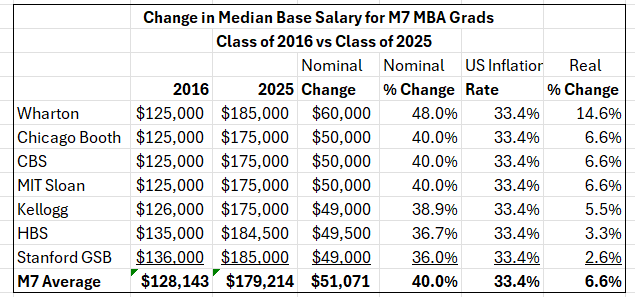
Over this ten-year period, cumulative US inflation was 33.4%.3 Since the average nominal growth in M7 median base salaries was 40%, the real purchasing power of those salaries still increased by approximately 6.6%. Put differently, MBA graduates from the M7 have largely preserved—and modestly increased—their purchasing power despite one of the highest inflationary periods in decades. That is a notable outcome, and suggests that leading MBA employers continue to place a premium on graduates of the top MBA programs.
While the value of the MBA has still increased over the past ten years, the view is more nuanced when looking at the year-by-year data. To provide more context, below is a table showing the changes in median base salary by year over the past ten years for M7 MBA graduates, as reported in the MBA employment reports:
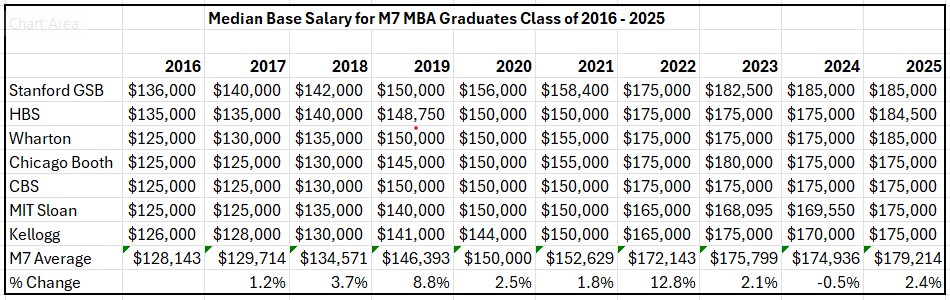
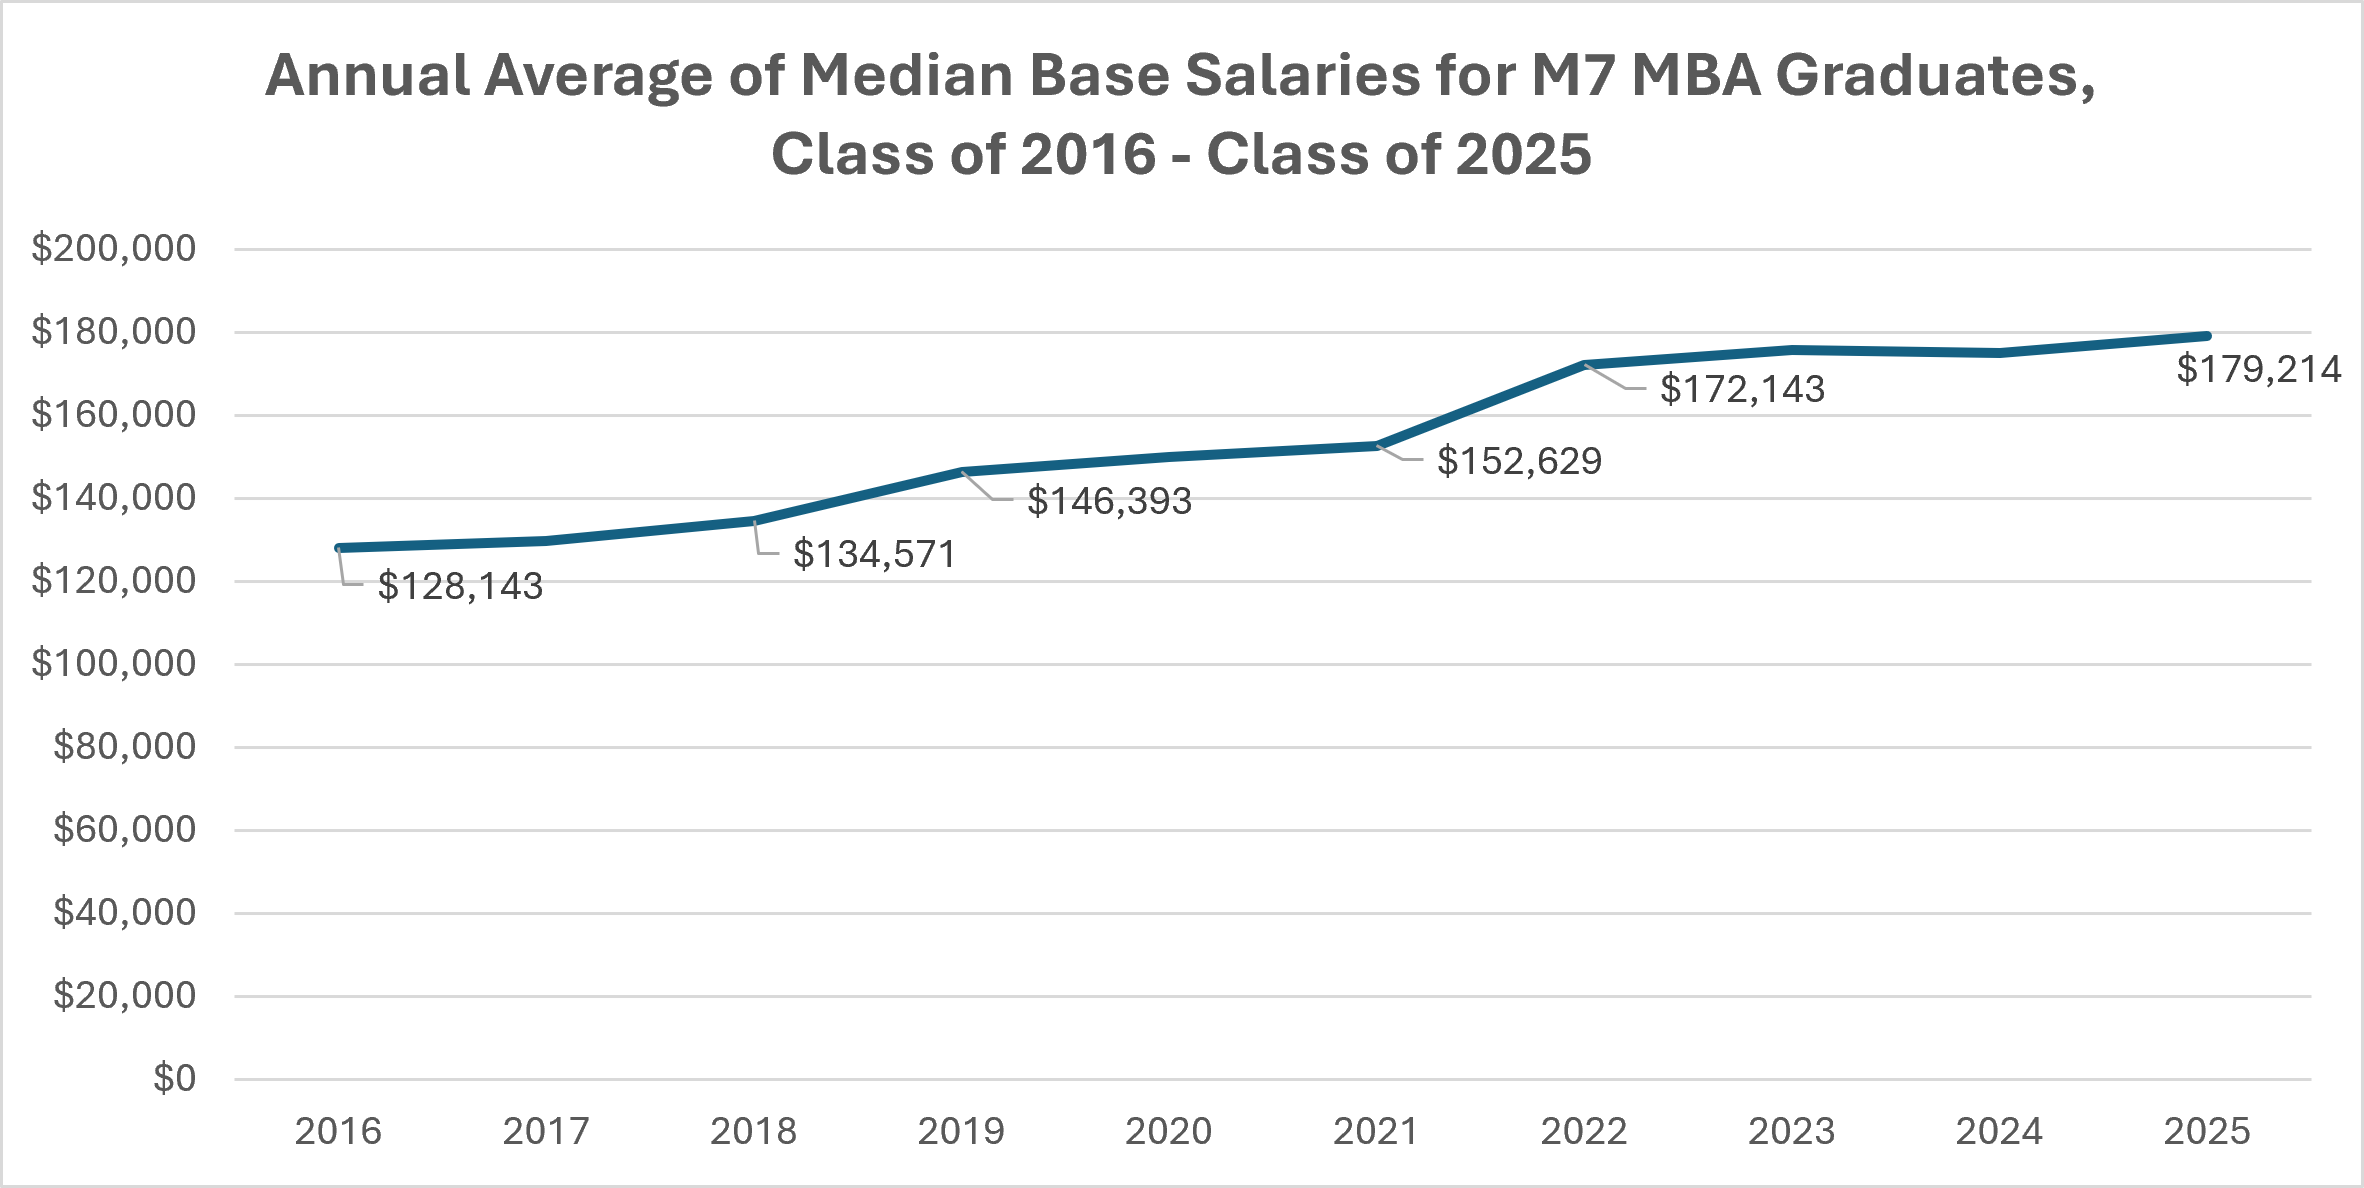
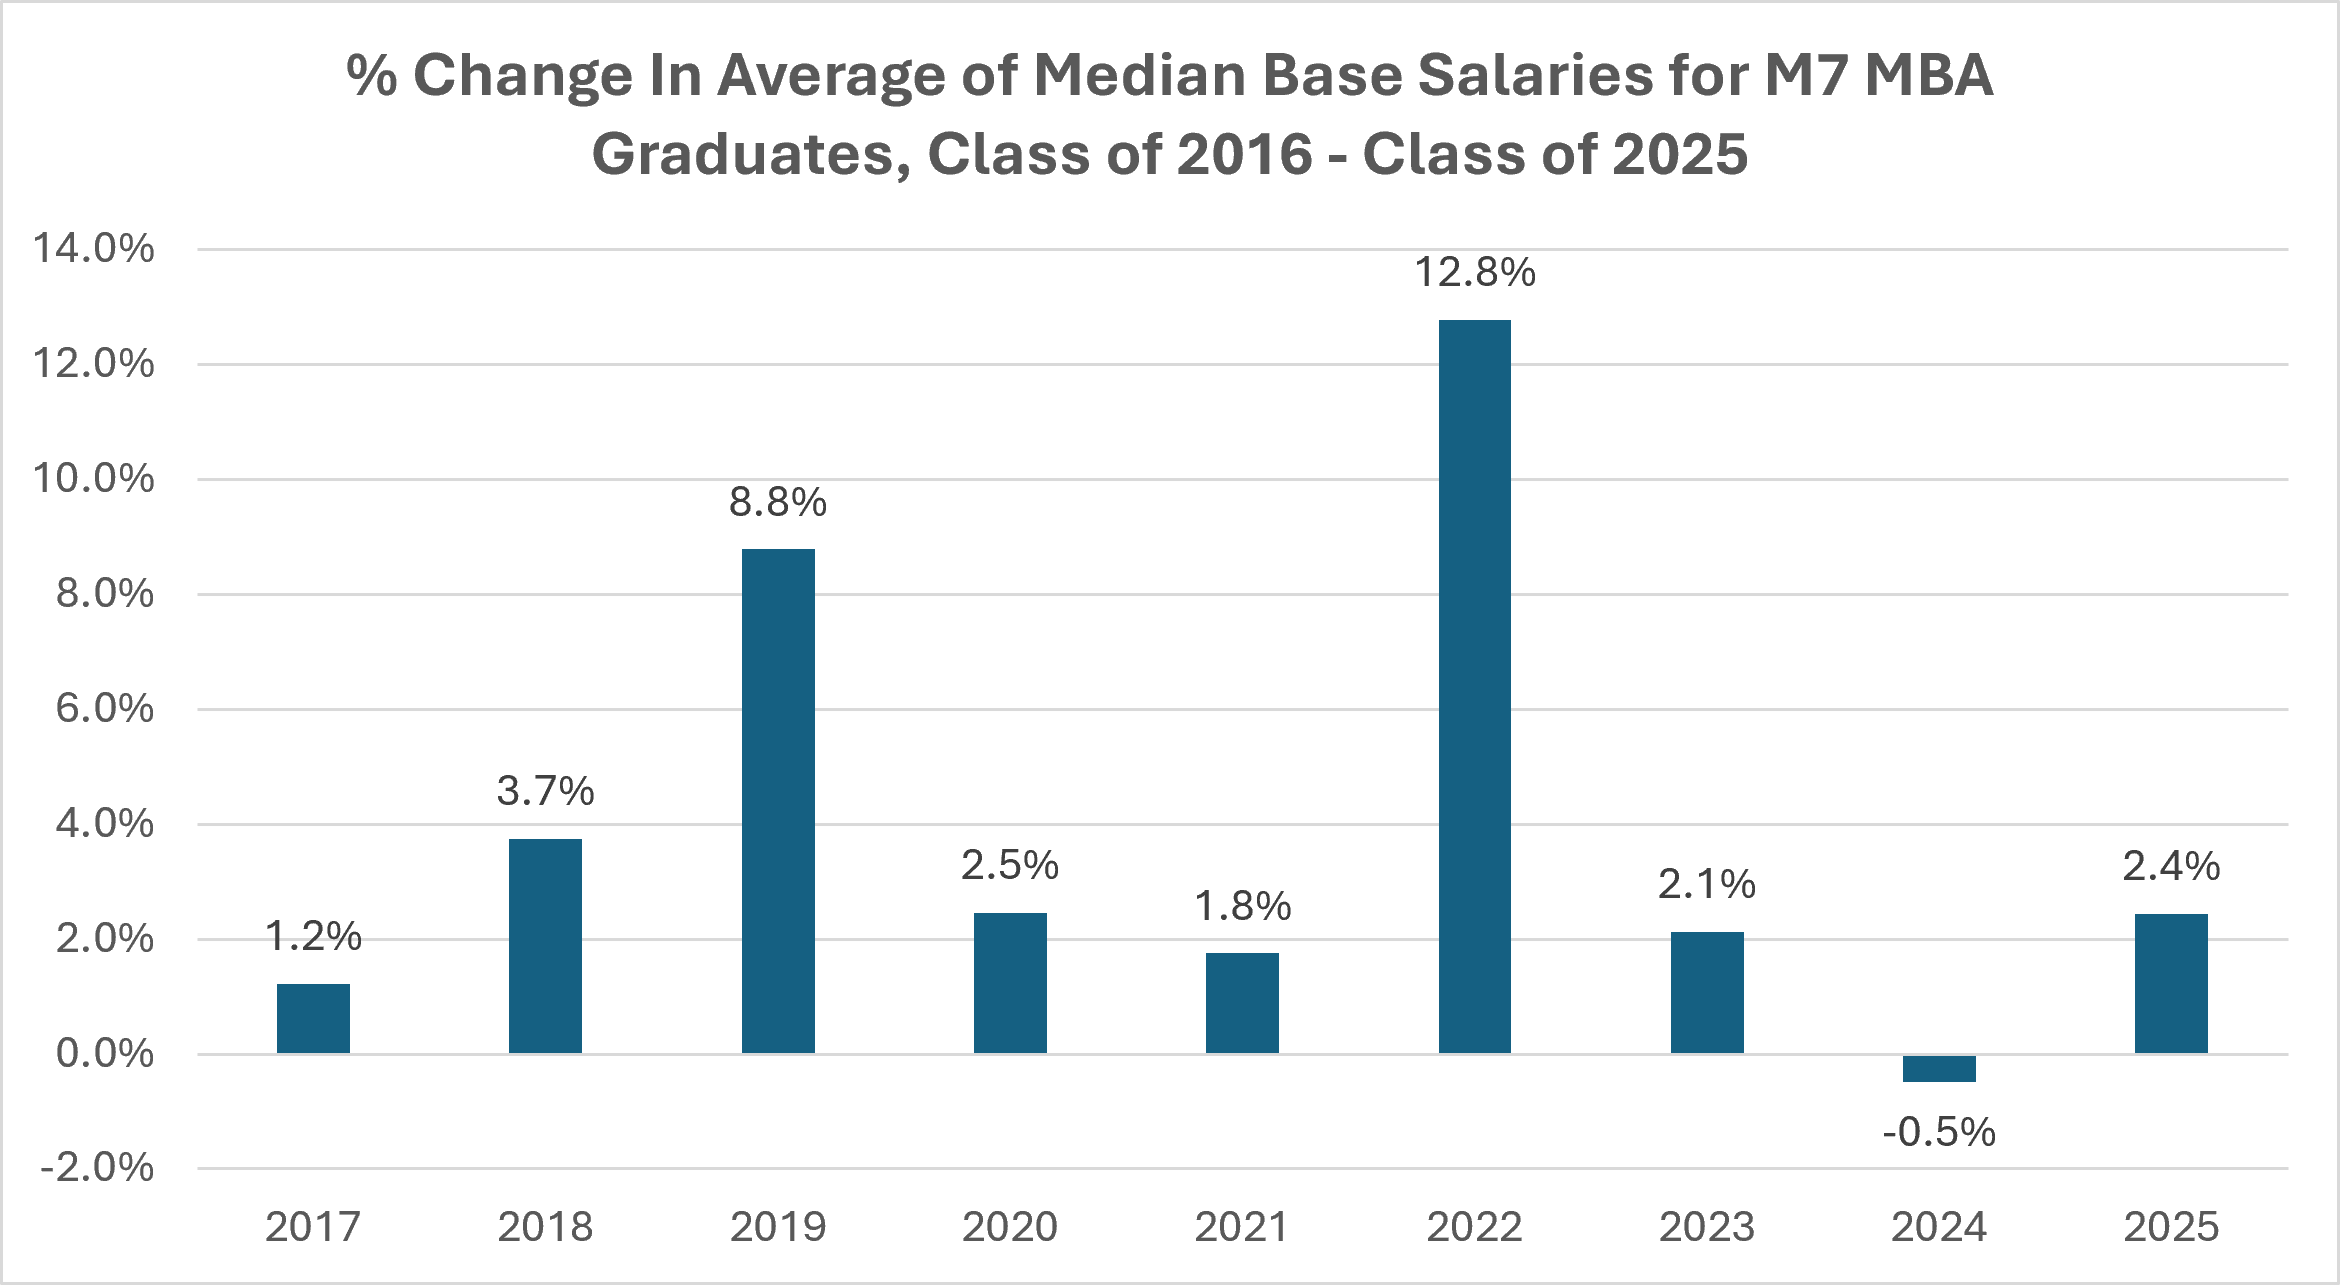
These jumps occurred in 2019 and 2022, years when demand for talent was especially strong. The 2022 increase, for instance, is widely attributed to a post-pandemic hiring surge in which technology, consulting, and finance firms competed aggressively for the same pool of MBA talent. As competition cooled in the years that followed, growth slowed accordingly: Median base salaries rose just 2.1% in 2023, dipped slightly (-0.5%) in 2024, and edged up 2.4% in 2025.
To account for inflation, here is a table showing the US annual inflation rate as compiled by the US Bureau of Labor Statistics:

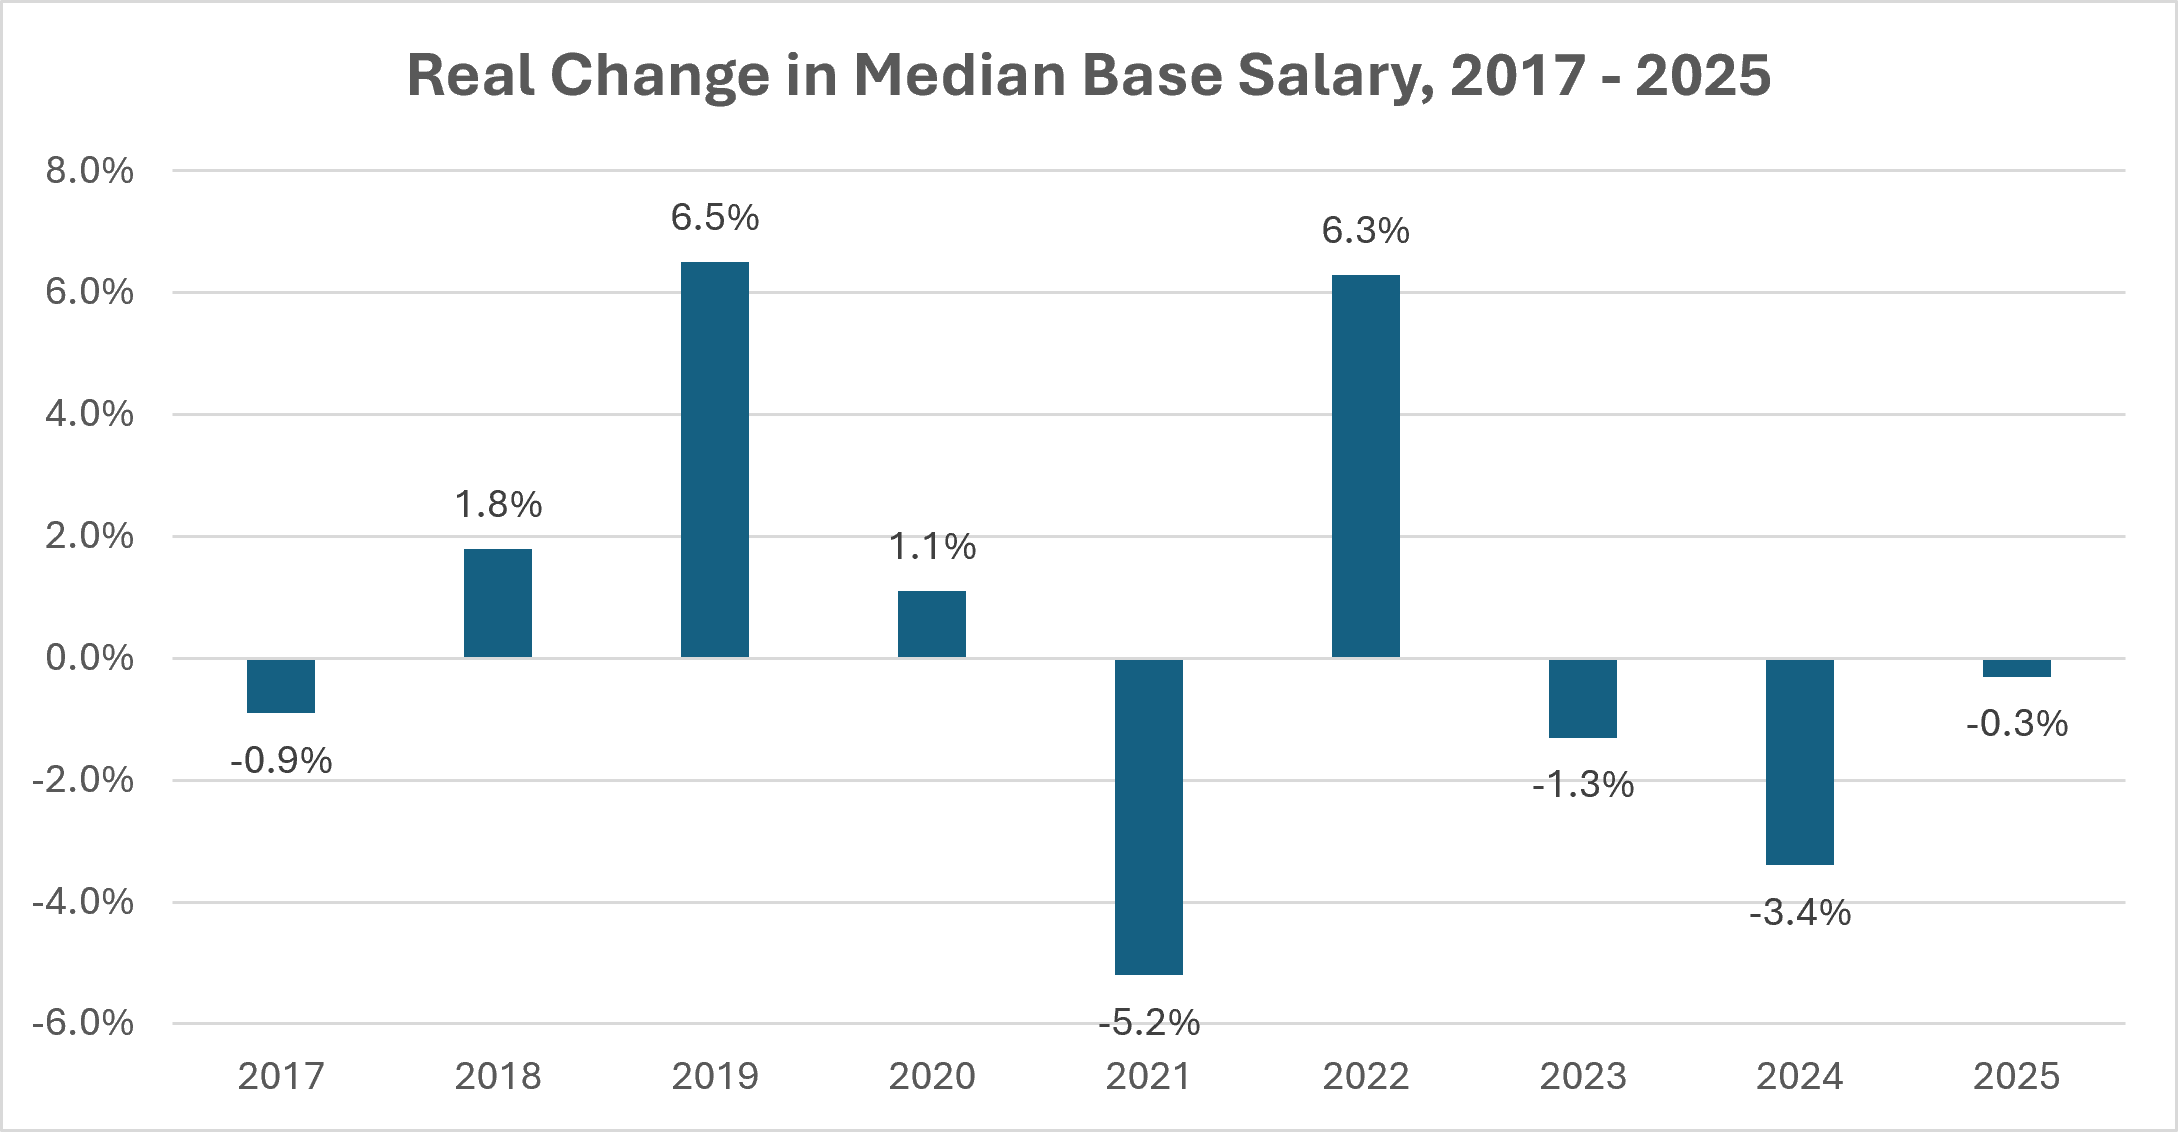
Subtracting the change in US inflation from the change in M7 median base salary by year shows that the M7 median base salaries had 6.3% growth in 2022, followed by a -1.3% decline in 2023 and a -3.4% decline in 2024. 2025 was about even at -.3%. This shows that the real purchasing power of the base salary has softened in the last three years compared to the increase in 2022. This makes sense given that the MBA job market did soften in the last two years driven in part by the pullback in hiring led by Big Tech firms.
A School by School Breakdown
Reviewing each program individually shows that all seven MBA programs showed roughly parallel growth.
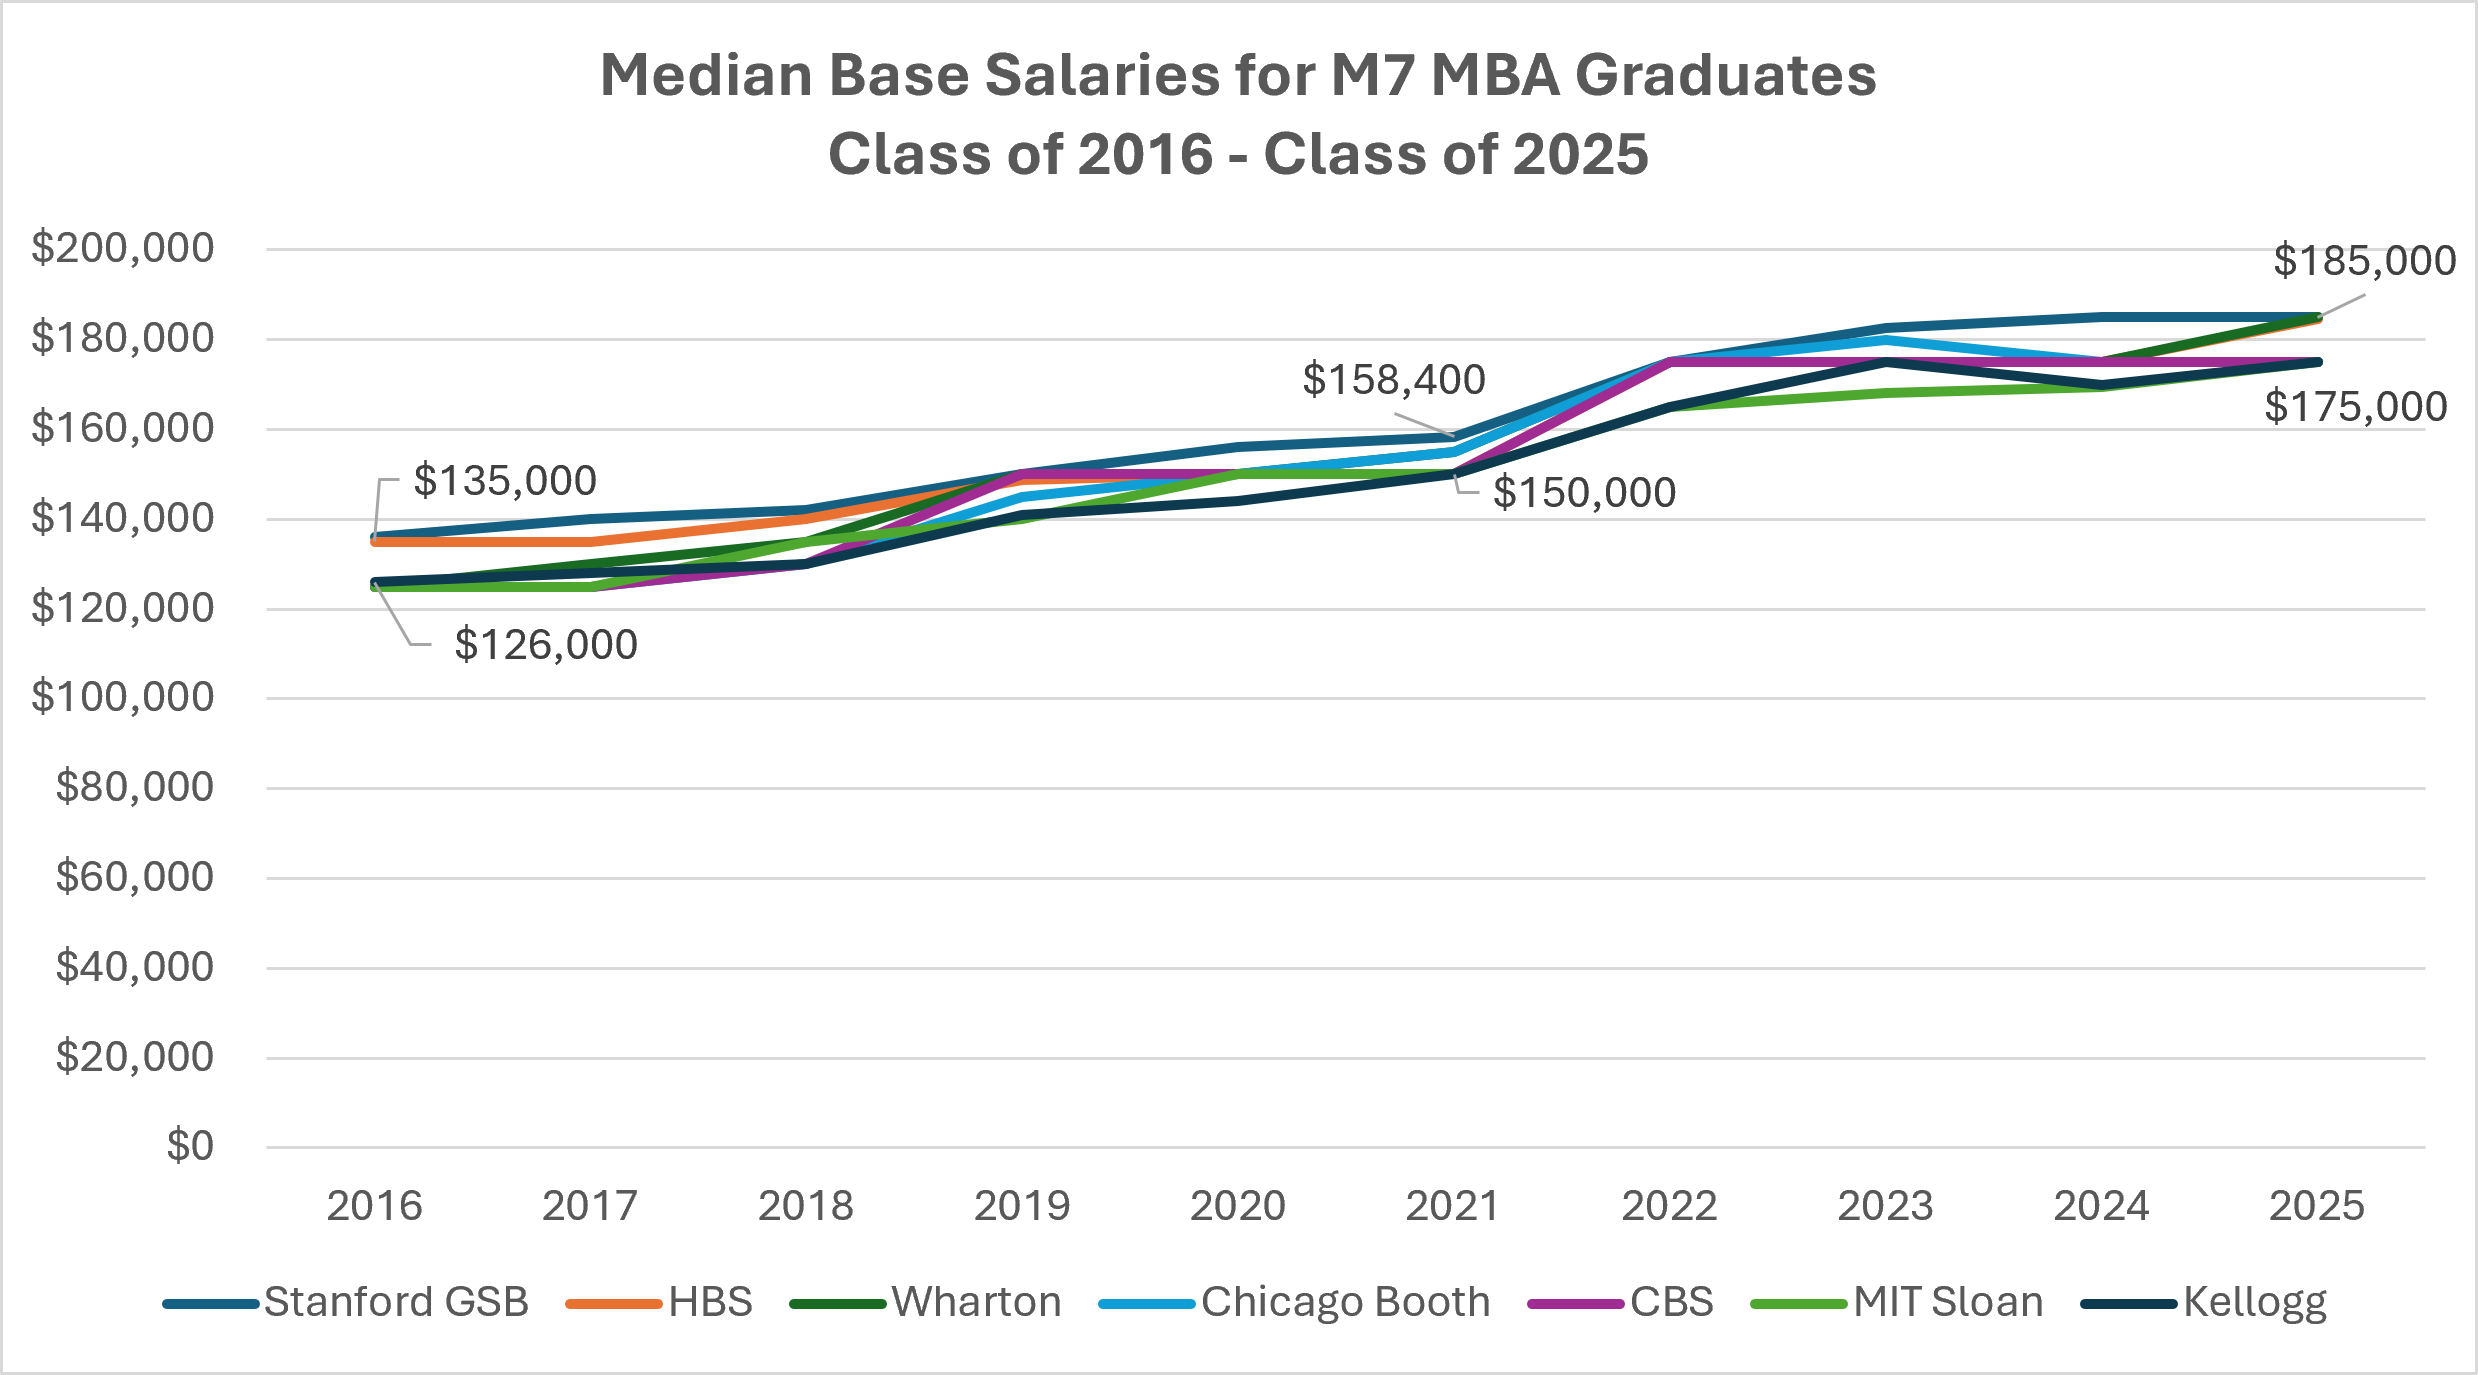
As noted earlier, six of the M7 programs reported close to a $50,000 increase in the base salary while Wharton reported a $60,000 increase in the base salary. In addition, HBS, Stanford and Wharton all posted close to a $185,000 median base salary for 2025 while Booth, CBS, MIT Sloan, and Kellogg have a $175,000 median base salary for 2025.
Notably, both HBS and Wharton were still at $175,000 in 2024 before jumping to $184,500 and $185,000, respectively, in 2025. If the pattern that followed the 2022 step-up repeats, the remaining M7 schools may see a similar catch-up in the next year or two.
In conclusion, while hiring conditions have fluctuated over the past decade, employer willingness to pay premium salaries for graduates of leading MBA programs has remained remarkably resilient. Although recent salary growth has slowed after adjusting for inflation, median compensation remains substantially higher than it was ten years ago.
- The median base salary reported in the MBA employment reports is the salary data reported by the subset of MBA graduates who were seeking employment and accepted a job. Meaning, MBA graduates who were company sponsored and those graduates who started entrepreneurial ventures are not counted in the salary data because they are not considered to be seeking employment. While the median base salary information does not cover 100% of the graduates, it does cover most of the graduates. In addition, we did not use the average base salary because the averages are higher due to a small subset of MBA graduates who received very large salaries. Meaning, the median base salary is more indicative of what the typical MBA graduate would expect to receive.
- Base Salary vs Total Compensation: In addition to receiving a base salary, MBA graduates often also receive signing bonus and variable compensation. However, we only included the base salary information and not the signing bonus data or the variable compensation data because the salary data is reported by virtually all of the MBA graduates accepting jobs while only a subset of these graduates reported their bonus and variable compensation.
- How the 33.4% inflation rate for the ten-year period was calculated using the Consumer Price Index Data compiled and published by the US Bureau of Labor Statistics:
- December 2024 CPI-U (315.605): from the BLS Consumer Price Index news release covering December 2024 data, published January 15, 2025: https://www.bls.gov/news.release/archives/cpi_01152025.htm
- December 2015 CPI-U (236.525), along with the full monthly historical series: from BLS’s historical CPI-U supplemental data tables. The December 2015 CPI-U value is from a BLS PDF here: https://www.bls.gov/cpi/tables/supplemental-files/historical-cpi-u-202412.pdf
- (315,605-236,525)/236,525 = 33.4%