

The last couple of weeks have been very busy indeed as the majority of schools we cover on Clear Admit released final decisions to their Round 1 applicants. MBA LiveWire saw record activity as the community chimed in to share their individual results with each other.
We thought it would be interesting to do some data analysis on these results and are excited to share our findings. We should stress, though, that the data is very likely subject to response bias, by which we mean that candidates with positive results may be more inclined to share them, resulting in underreported rejections. (We don’t actually think Harvard Business School accepted more than 80 percent of the candidates it interviewed in Round 1, for example.) We should also point out that our sample size is still relatively small as compared to the total applicant pool at each of the schools.
With these limitations in mind, we did draw a few interesting conclusions when we crunched the numbers, ones we think are worth noting if you are a current applicant or still in the process of considering which schools to apply to.
Little Difference in Stats for Accepted Versus Rejected Candidates at Top Schools
One of the things that jumped out to us the most was that at the very top schools, there is very little difference between the average GMAT scores and GPAs of candidates who were accepted versus those who were rejected. In most cases, the difference in GMAT score was a matter of a point or two, and in some instances, the average stats were even marginally higher for rejected candidates than for accepted candidates. At Stanford Graduate School of Business, for example, the average GPA for admitted candidates was 3.69 and the average GMAT score was 738, as compared to averages of 3.64 and 740 for rejected candidates and 3.53 and 750 for waitlisted candidates. At the University of Chicago Booth, meanwhile, accepted candidates boasted an average GPA of 3.67 and average GMAT score of 741, again, not terribly far off from the 3.63 and 3.61 average GPAs and 739 and 735 average GMAT scores for rejected and waitlisted candidates, respectively.
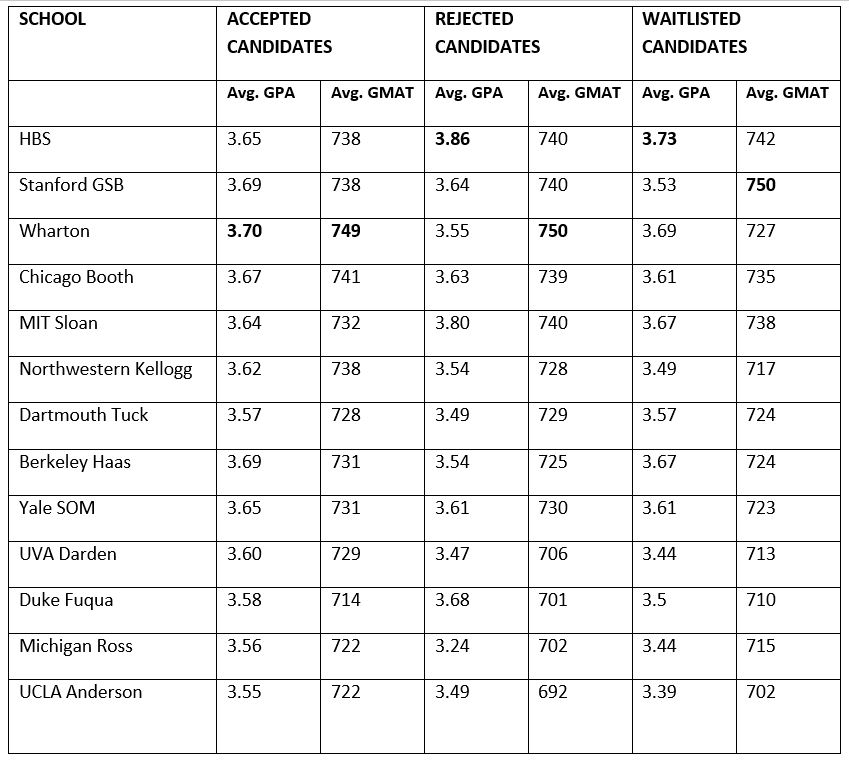
To us, this makes sense. At the very top schools, while GMAT scores and GPAs are important qualifiers, they alone are not enough to make a candidate stand out. Because these schools get many applications from highly qualified candidates, their final selection is based on a much more nuanced mix of considerations that extends beyond stats to include attributes like leadership potential, impact at work, community impact, and goal focus. Bear in mind, too, that for the majority of schools covered here, the candidates whose data we analyzed for this post had already been invited to interview, which means that candidates whose low stats likely took them out of the running earlier in the process have not been included. (See note below for exceptions.)
Schools outside the so-called M7—which are not always as fortunate to have the many, many applicants with great numbers that a Harvard, Stanford or Wharton can count on—therefore need to pay closer attention to stats and, as a result, these schools sometimes reflect a larger spread between the average GPA and GMAT scores of accepted versus rejected candidates.
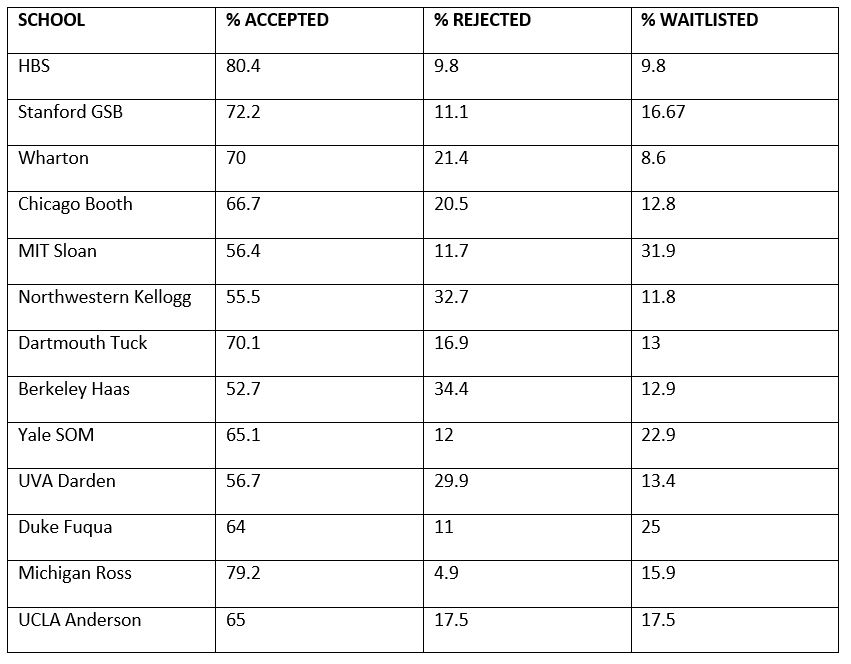
How Schools Use Their Waitlists
Another interesting point that drew our attention was the percentage of students placed on the waitlist at a given school relative to the percentage admitted. Schools place students on a waitlist for one of two main reasons. The first, and most important, is because they don’t know their yield from this admissions group or the size and quality of Round 2 candidates. Placing some students on the waitlist allows all schools to match waitlisted candidates against those who apply in later rounds.
But when a given school has a higher percentage of candidates on its waitlist as compared to accepted students, it might sometimes suggest that the school could also be using the waitlist to weed out candidates they feel might opt to attend another school over theirs if they get in. How these candidates react to the waitlist decision will sometimes then help the schools determine whether to admit them in a later round.
Note: Duke University’s Fuqua School of Business, Northwestern’s Kellogg School of Management and Dartmouth’s Tuck School of Business allow all candidates to interview, which means that their data is representative of the entire application pool, not a subset that had already passed a qualifying round of sorts in order to be invited to interview. Taking this into consideration, the broader range between the average stats for accepted and rejected candidates at Kellogg (3.62 and 738 versus 3.54 and 728) makes sense. We have also excluded Columbia Business School from this analysis. Because that school has a rolling admissions process, there were not adequate data points in the specific weeks we looked at to provide meaningful results.


